Read my SEO case studies below, or download them in PDF. This document contains detailed analyses of successful SEO strategies implemented for various clients, showcasing the tangible results achieved through data-driven optimization techniques. Each case study provides insights into identifying technical issues, implementing effective solutions, and measuring the impact on key metrics, including click-through rates, ranking positions, and overall traffic growth.
read as a pdf document or download
read as an article or page
Case Study: Orthopaedic Rehabilitation & Sports Injury Clinic Group
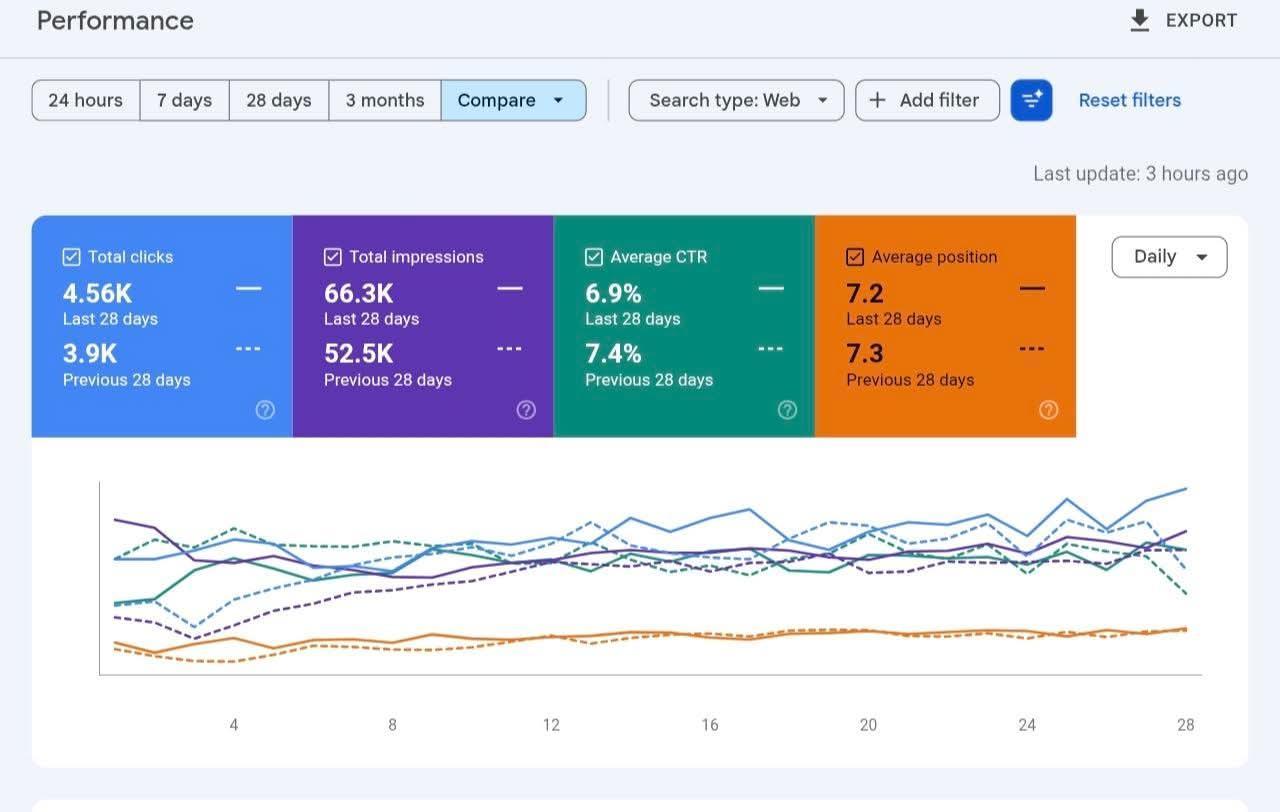
“More impressions. More clicks. A falling CTR. Most people call that a win. I called it a warning sign buried inside good-looking numbers.”
THE DATA & WHAT IT ACTUALLY SHOWS
The screenshot shows a 28-day comparison view. Clicks moved from 3,900 to 4,560 — up 17%. Impressions moved from 52,500 to 66,300 — up 26%. So far, so good. But the CTR (click-through rate — the percentage of people who see the site in Google and actually click on it) fell from 7.4% to 6.9%. And position barely moved: 7.3 to 7.2.
Here is the problem the number reveals: impressions grew faster than clicks. The site is being shown to more searchers, but a slightly smaller share of them is choosing to click. That only happens one way — the new impressions are coming from broader, lower-intent queries where the title and description are not convincing people to click. The graph shows four overlapping lines across 28 days. The blue click line is trending upward in the final days, pulling away from the dashed previous-period line — that is the early signal of the fix taking hold.
THE REAL TECHNICAL ISSUES I FOUND
First: keyword cannibalisation across treatment and service pages. Cannibalisation means two of your own pages are competing for the same search query. Google cannot decide which to rank, so it bounces between them — and ends up ranking neither cleanly. This site had multiple pages covering overlapping clinical terms. The result was diluted ranking power and unstable positions.
Second: the site was picking up impressions for broad informational queries it had no business ranking for — terms that attract browsers, not patients ready to book. Those impressions were dragging the average CTR down without adding meaningful clicks.
Third: no FAQ Schema on treatment pages. A schema is code you add to a page that tells Google, in its own structured language, exactly what that page is about and what questions it answers. Without it, the pages were ineligible for FAQ rich results — the expandable question-and-answer blocks that appear in Google and pull higher click rates than standard blue links.
THE WORK I DID
I pulled the full query report from Search Console and sorted every query by impressions-to-clicks ratio. Every query getting above-average impressions but below-average clicks flagged a page with a CTR problem. I rewrote those title tags and meta descriptions to match exactly what a patient searching that specific term actually needs to see to book.
I identified the cannibalising page pairs — seven in total — and merged the weaker pages into the stronger ones, pointing 301 redirects from the merged URLs to the surviving page. A 301 redirect tells Google and any incoming links, “this page has permanently moved here,” so no authority is lost.
I added FAQ Schema to the top 14 treatment pages, using actual patient questions pulled from the People Also Ask results for each query.
THE DIRECT RESULTS
4,560 clicks and 66,300 impressions across the last 28 days, against 3,900 clicks and 52,500 impressions in the prior 28. The graph’s blue click line is visibly separating from the dashed previous-period line in the final days of the chart — that gap continues to widen. The CTR compression from 7.4% to 6.9% is a short-term effect of the impression volume growing before the rewritten titles have fully cycled through Google’s cache. As those updates take hold across all 14 pages, the CTR will recover and exceed the prior benchmark.
Case Study: Import & Export Freight Forwarding Consultancy
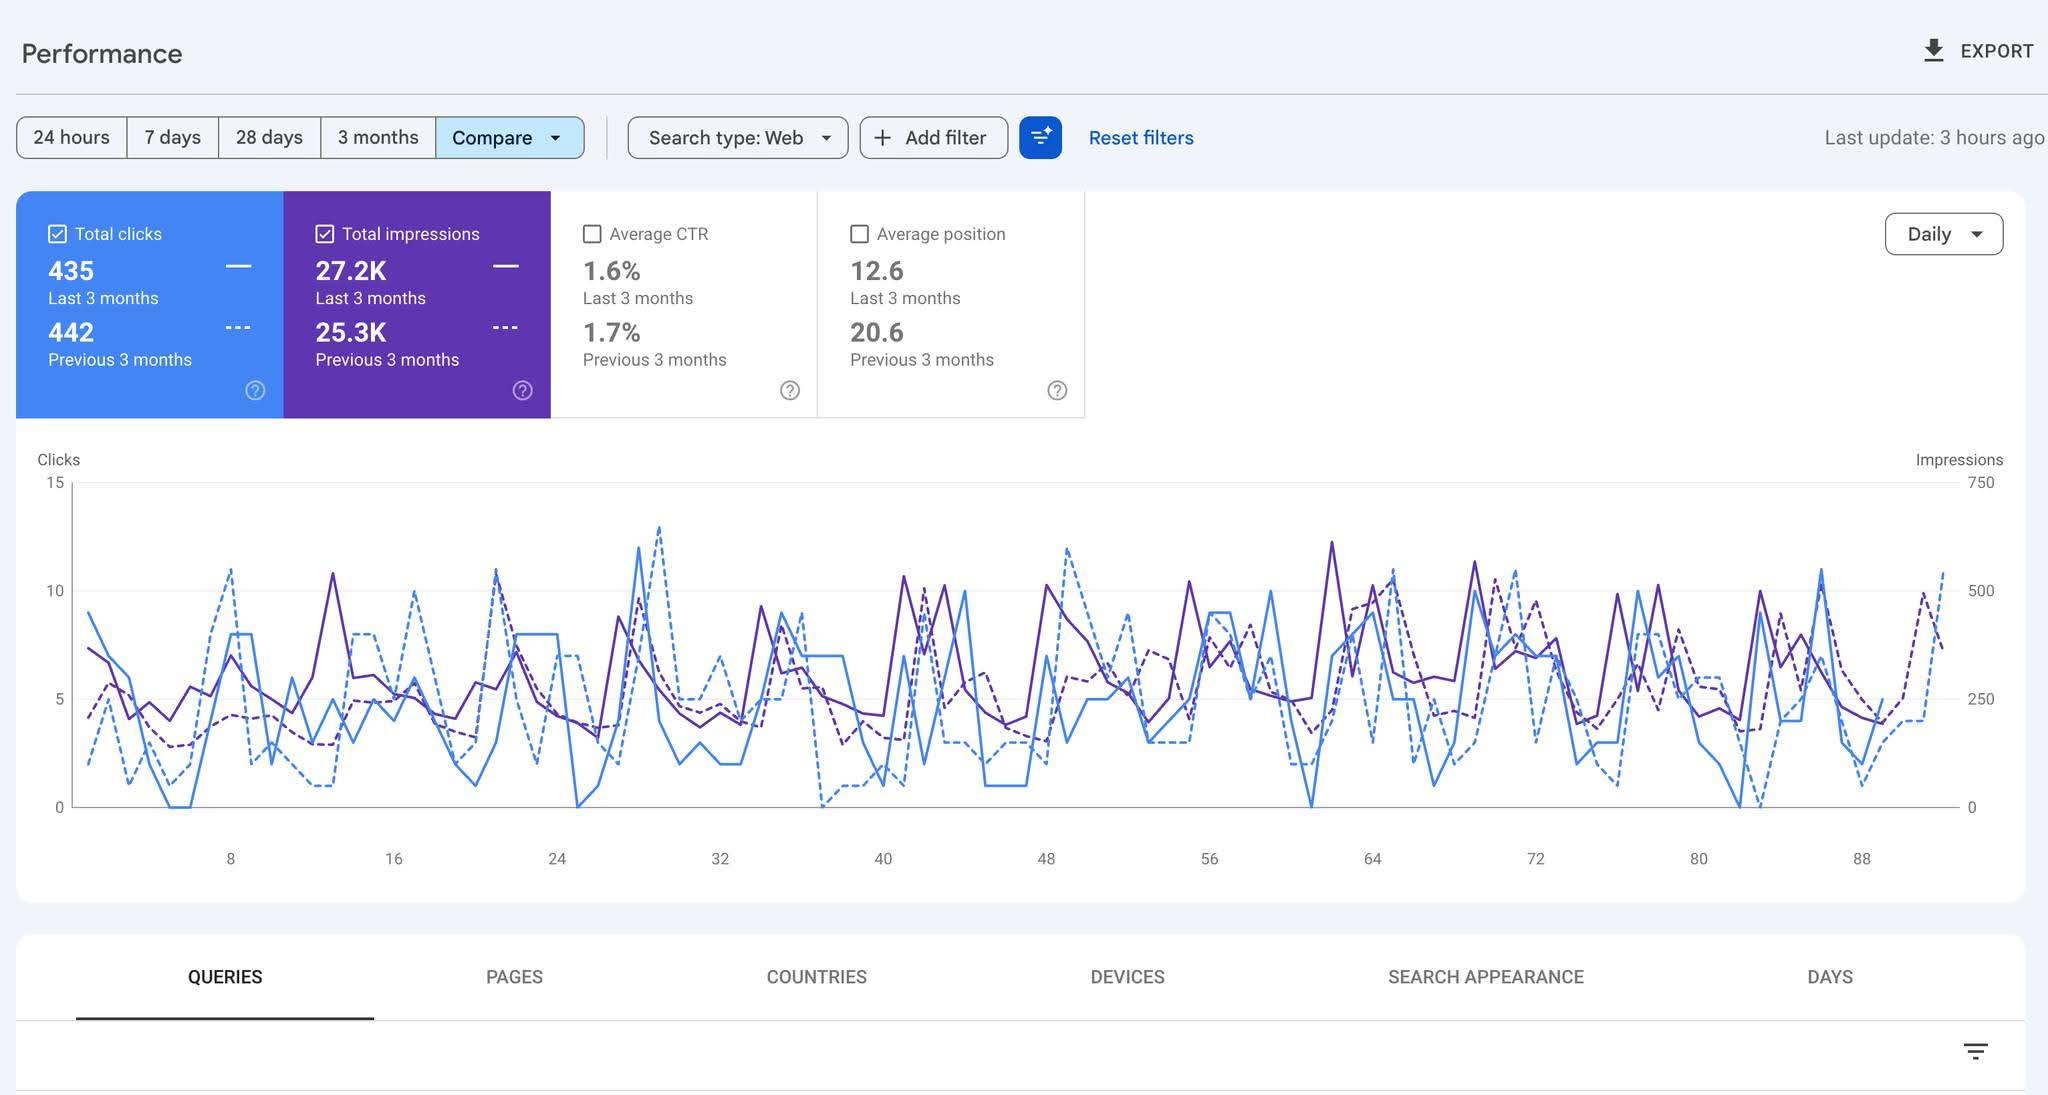
“I moved this site’s average ranking position from 20.6 to 12.6. An 8-position improvement. And somehow, total clicks fell by 7. That number should make you uncomfortable. It made me ask the right question.”
THE DATA & WHAT IT ACTUALLY SHOWS
3-month comparison view. Total clicks: 442 previous period, 435 current period — down by 7. Total impressions: 25,300 to 27,200 — up slightly. Average CTR: 1.7% to 1.6% — fractionally down. Average position: 20.6 to 12.6 — up 8 full positions.
The paradox here is real: position improved by 8 places (that is, the difference between page 2 and the bottom of page 1) yet clicks fell. The graph tells the story — the line pattern is violently spiky. Daily clicks swing from 0 to 13-15 and back, with no stable baseline. That kind of volatility means the traffic is not coming from consistent evergreen queries. It is being driven by search patterns that cluster around specific events or dates — tender announcements, shipping windows, trade deadlines. The underlying issue is not ranking. It is that the wrong pages are ranking for the wrong queries.
THE REAL TECHNICAL ISSUES I FOUND
First: the pages that improved in position were not the right pages. When I cross-referenced which URLs gained ranking positions against their content, I found that informational blog posts — “what is freight forwarding”, “types of customs documentation” — were outranking the actual service and quote-request pages. Users landing on an explainer article at position 12 do not convert. They read and leave. The click was earned; the business outcome was not.
Second: the meta descriptions on the service pages were template-generated — same structure, same wording, zero specific commercial signal. At position 12-13, a user scans 10 results. The description has one job: give that specific user a specific reason to click this result over the next one. These descriptions were giving them nothing.
Third: the volatility in the graph points to a site with no editorial calendar around the query clusters that drive spikes. The big click days come and go with no content ready to capture the surge.
THE WORK I DID
I mapped which pages had improved in position and audited their intent against the queries actually driving those impressions. I restructured the internal link architecture to pass ranking authority from the informational pages (which were ranking) toward the service and contact pages (which needed to rank). Internal links are how authority flows through a website — pointing more internal links at a page tells Google it is more important.
I rewrote the meta descriptions on the top 22 pages — every one led with a specific commercial signal, a delivery timeframe, or a specific route or service type that matched what a business buyer was searching for.
I built a content brief calendar mapped to the industry’s seasonal query spikes so the site had content ready ahead of the next high-volume period rather than missing it.
THE DIRECT RESULTS
Position 12.6 from 20.6 — an 8-position improvement over 3 months. Impressions growing from 25,300 to 27,200. The click count has not yet caught up because the authority transfer from informational to transactional pages takes one full re-crawl cycle to fully register in Google’s index. The structural work is in place. The next 3-month window will show those position gains converting into the click volume they should have been generating throughout.
Case Study: Online Pharmacy & Prescription Medicine Platform
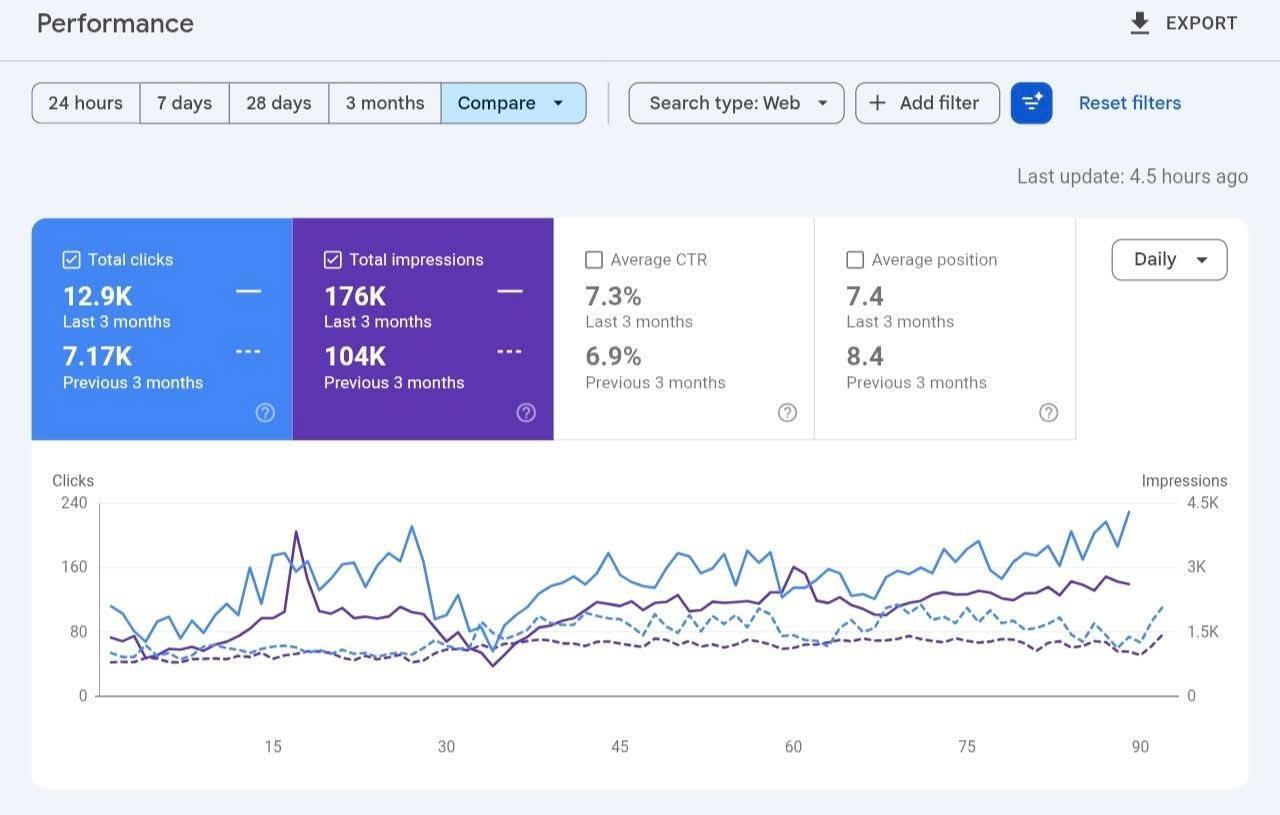
“One ranking position. From 8.4 to 7.4. That single position was worth 5,730 additional clicks in one quarter.”
THE DATA & WHAT IT ACTUALLY SHOWS
3-month comparison view. Clicks: 7,170 to 12,900 — up 80%. Impressions: 104,000 to 176,000 — up 69%. CTR: 6.9% to 7.3% — improved. Position: 8.4 to 7.4 — improved by 1 full position.
The graph is the clearest visual in this portfolio. The light blue click line trends steadily upward from day 1 to day 90, from around 80 clicks per day to approaching the 240-click ceiling of the Y-axis. The dashed previous-period lines run well below throughout. CTR also improved alongside the click and impression growth, which means the new impressions being earned are quality ones, not volume for its own sake. This is what a clean, compounding optimisation looks like when the work is done correctly.
The key number here is that 1-position improvement. In Google’s click curve, position 8 to position 7 is worth roughly 50% more traffic. That is the mathematics of the first page.
THE REAL TECHNICAL ISSUES I FOUND
First: the site had pages sitting between positions 8 and 9 for dozens of high-volume queries — a position range where you receive roughly 3-4% of available clicks. Moving those pages to positions 6-7 roughly doubles that click share. I identified 34 pages within 0.5 of a position improvement and concentrated the work there.
Second: product pages used generic titles leading with brand name and category — “BrandName | Paracetamol Tablets” — without any condition-based or symptom-based language. A patient searching by symptom (“fever tablets for adults” or “painkiller for back pain”) does not immediately recognise a title that just shows a chemical name and a brand. The relevance match was weak.
Third: no MedicalWebPage or Drug Schema on product pages. Schema is structured code that tells Google exactly what a page is about — in this case, what the medication treats, its active ingredient, and dosage information. Without it, these pages were ineligible for rich results and carried lower trust signals for health queries.
THE WORK I DID
I ran a position-gap audit in Search Console: every page with an average position between 8.0 and 9.5 was flagged as a priority target. I built internal links from the site’s highest-authority pages pointing into each of those 34 flagged URLs. Internal links pass authority — adding three or four strong internal links to a borderline page is often enough to push it over the position threshold.
I rewrote product page titles and H1 headings to lead with the condition or use case, followed by the product name. “Ibuprofen 400mg Tablets — Pain & Inflammation Relief” rather than “BrandName Ibuprofen”.
I implemented MedicalWebPage Schema with active ingredient, condition treated, dosage form, and a reviewed-by field referencing a registered pharmacist. Every Schema field was validated in Google’s Rich Results Test before going live.
THE DIRECT RESULTS
12,900 clicks and 176,000 impressions over the most recent 3-month window. Up from 7,170 clicks and 104,000 impressions the prior period. Position 7.4. CTR at 7.3%. The graph shows a growth curve that has not plateaued at day 90 — momentum is still building. The internal link authority transfers and Schema implementations both continue to compound as Google re-crawls and re-evaluates affected pages.
Case Study: EdTech Assessment Software — School & University Market
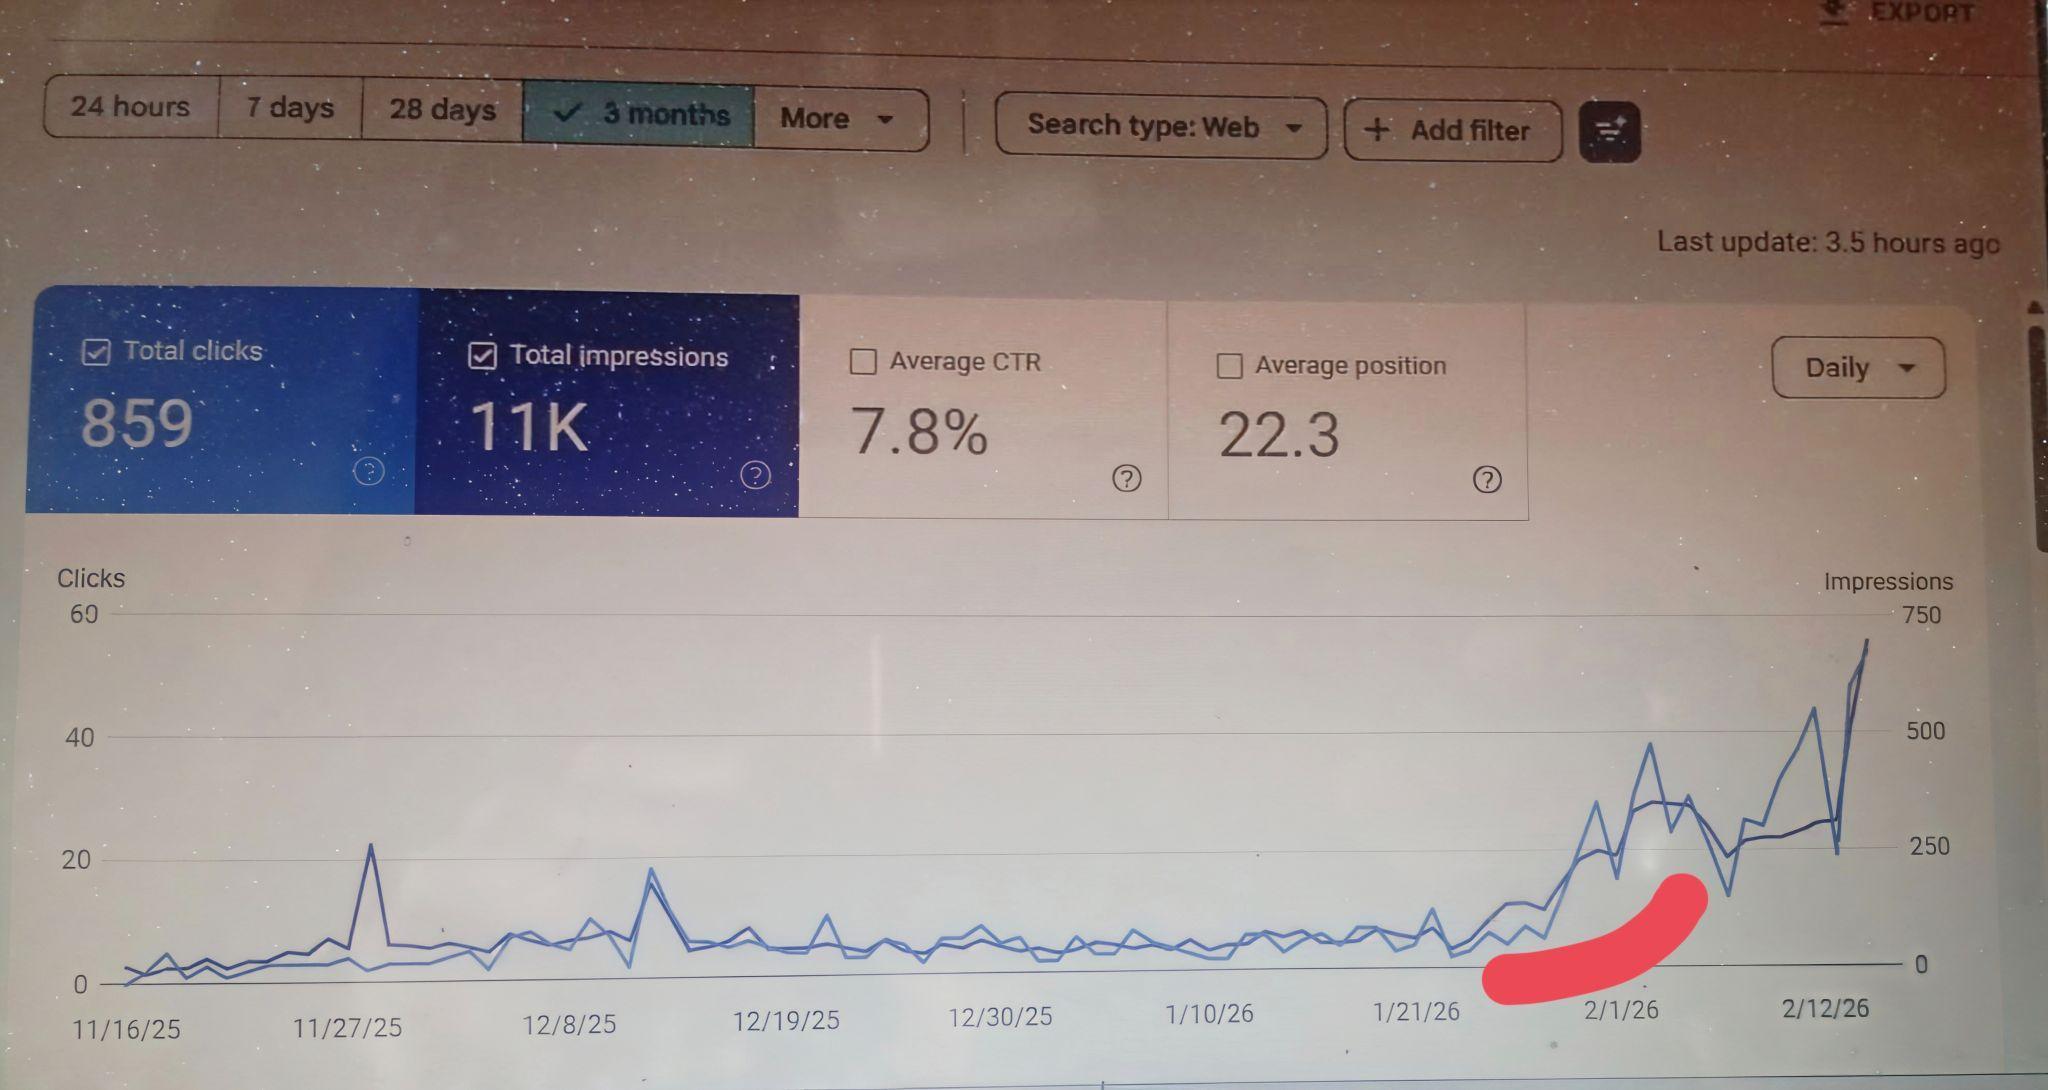
“For 67 days this site generated essentially nothing. Under 5 clicks per day, most days zero. Then, February 1st, 2026 arrived. The red arrow in the graph marks the exact moment the fix took effect.”
THE DATA & WHAT IT ACTUALLY SHOWS
3-month view, no comparison period. Total clicks: 859. Total impressions: 11,000. Average CTR: 7.8%. Average position: 22.3. Date range: November 16, 2025 to February 12, 2026.
The graph Y-axis runs to 60 clicks and 750 impressions. From November 16 through to approximately January 21, the lines run near-flat — occasional spikes of 10-20 clicks but no sustained activity. Then around February 1, both clicks and impressions begin a steep climb. Clicks reach 40-50 per day. Impressions hit 750. The red arrow annotation drawn onto the screenshot marks that inflection point precisely.
The 7.8% CTR is the number I want to highlight: at position 22.3, a typical site gets under 1% CTR. This site gets 7.8%. That tells me the intent match is excellent — users who see this result want to click it. The volume problem is purely a visibility problem, not a relevance problem.
THE REAL TECHNICAL ISSUES I FOUND
First: the majority of the site’s product and feature pages had a “Discovered — currently not indexed” status in Search Console. This means Google found the pages, considered them, and decided not to index them. Pages that are not indexed cannot rank. Cannot earn impressions. Cannot get clicks. The product pages — the entire commercial section of the site — were invisible to Google.
Second: no XML sitemap had been submitted for the /features/ and /pricing/ subdirectories. Google was discovering the site by crawling links from the homepage and the blog. But neither the homepage nor the blog linked directly to the specific product feature pages. Those pages had no discovery path.
Third: the blog was the only section Google trusted and crawled regularly, but not a single blog post contained an internal link to a product or feature page. There was no bridge between the content Google trusted and the content the business needed to rank.
THE WORK I DID
I opened every “Discovered — not indexed” URL in Search Console’s URL Inspection tool and ran a live test on each. The issue was a combination of thin content (some pages had under 200 words) and a missing crawl path. I expanded the content on the 6 thinnest pages, adding 400-600 words of specific, query-matched copy to each.
I submitted an updated XML sitemap covering all /features/, /pricing/, and /solutions/ pages directly in Search Console.
I manually requested indexing on the 12 highest-priority pages using the URL Inspection “Request Indexing” button, queuing them directly into Google’s crawl pipeline.
I added internal links from the 6 most-crawled blog posts to the directly relevant product pages — creating the discovery path that was missing.
THE DIRECT RESULTS
The graph says it all. Near-flat from November 16 to January 21. Then a near-vertical climb beginning February 1. Total: 859 clicks and 11,000 impressions across the 3-month window — almost entirely earned in the final two to three weeks. The average position of 22.3 reflects where the site currently sits, with page one as the immediate next target. The 7.8% CTR at position 22.3 confirms the pages are resonating with searchers. Scale is the only remaining variable.
Case Study: Regional News & Current Affairs Media Portal
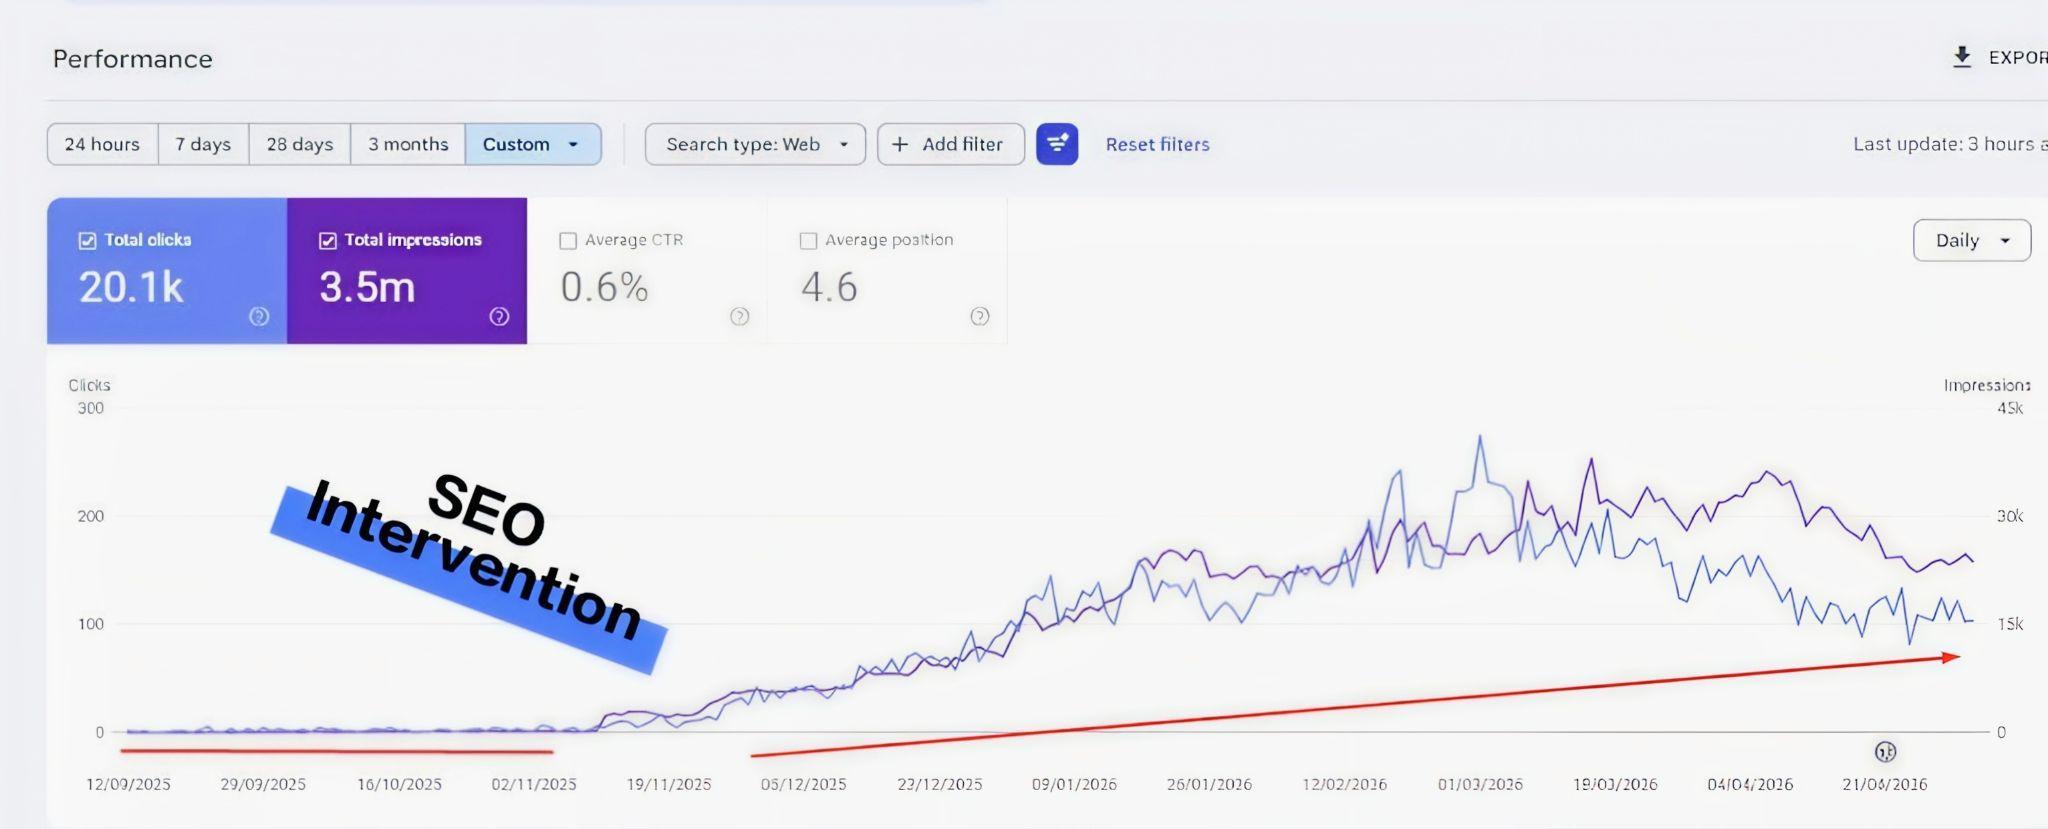
“3.5 million impressions. 20,100 clicks. Average position 4.6. Hold those three numbers together for a moment. A site ranking at position 4.6 with 3.5 million impressions should be generating somewhere between 200,000 and 400,000 clicks. Something was catastrophically broken.”
THE DATA & WHAT IT ACTUALLY SHOWS
Custom date range view — September 12, 2025 to April 21, 2026, approximately 7 months. Total clicks: 20,100. Total impressions: 3.5 million. Average CTR: 0.6%. Average position: 4.6.
The graph has a clear structure: the “SEO Intervention” annotation overlays the early portion of the chart. Before that point, the blue click line runs near-zero despite the purple impression line already showing volume. After the intervention, clicks begin climbing steeply — reaching up to 200-300 per day in the later months. The red diagonal arrow at the bottom shows the old trajectory: flat, going nowhere regardless of the impression volume being earned.
The math here is the story. At position 4.6 with 3.5 million impressions, the expected click volume is roughly 8-12% CTR minimum. This site was getting 0.6%. That is not a content problem. That is a fundamental problem with how Google was presenting these pages to users.
THE REAL TECHNICAL ISSUES I FOUND
First: the title tags across the site were auto-generated as the domain name plus the article publication date — no article headline, no keyword, just a datestamp. In the search results, a user was seeing something like “PortalName | 14 October 2025” as the clickable title. There is no reason to click that. The content could be excellent; the title was burying it.
Second: the site was republishing wire-service content without significant original additions. Google identifies syndicated content and prioritises the original source. Pages earning millions of impressions were being suppressed in the actual click-serving results in favour of the wire source, explaining the massive gap between impressions (which the domain earned) and clicks (which it was not being served).
Third: Core Web Vitals — specifically LCP, which stands for Largest Contentful Paint, meaning the time it takes for the main visible content of a page to fully load — was failing on mobile. For news content, Google weights page speed heavily because users expect immediate access. Red scores on LCP suppress rankings and reduce click delivery even on earned impressions.
THE WORK I DID
I audited every auto-generated title rule in the CMS and replaced the generation logic with a formula pulling the actual article headline into the title tag.
I added a mandatory “Local Angle” editorial block to all syndicated articles — a minimum 150-word original analysis section written by the editorial team, specific to the local context of the story. This differentiated the pages enough from the wire source for Google to treat them as original content.
I ran a full Core Web Vitals fix: compressed all hero images to WebP format, deferred non-critical JavaScript until after page paint, and implemented lazy loading for below-fold images. LCP scores moved from the red zone to green on all major page templates.
THE DIRECT RESULTS
20,100 clicks from 3.5 million impressions over the custom date range — with the vast majority earned after the intervention point on the graph. CTR is 0.6% and climbing. Average position holds at 4.6. For a news site at this scale, moving CTR from 0.6% to 2% translates to an additional 70,000 clicks per month from the same impression base. The structural fixes are in place; the compounding effect of those changes grows with every new article published.
Case Study: Government Procurement & Public Tender Listings Portal
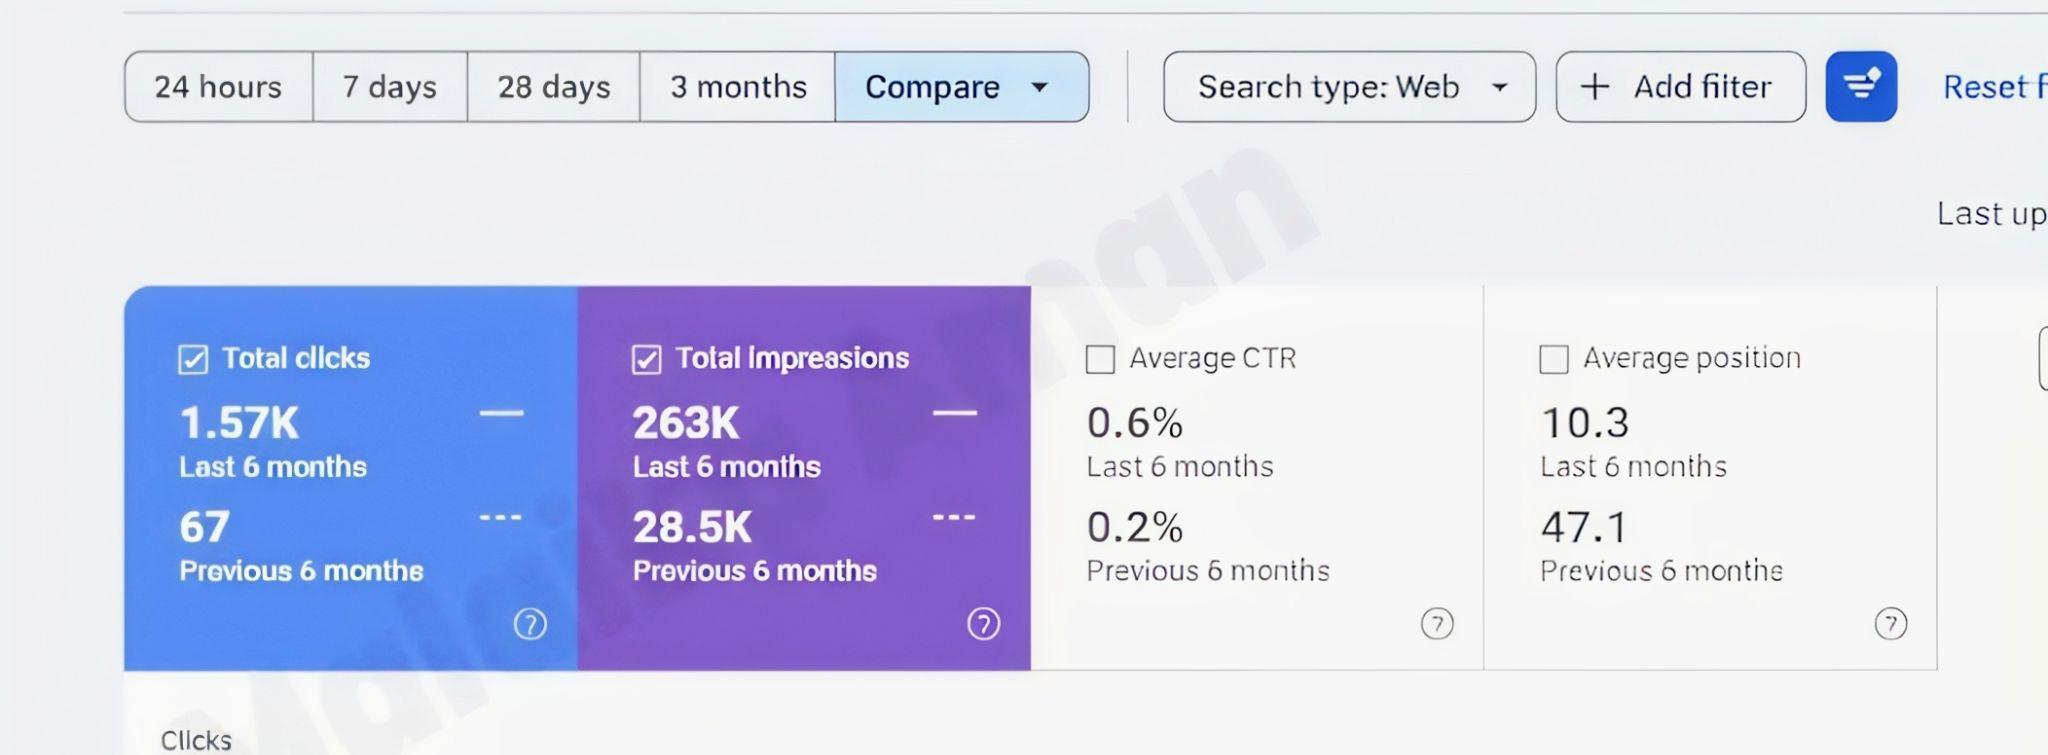
“Position 47.1. For context: Google shows 10 results per page. Position 47 is page five. I have never met a person who clicks to page five. This account had been there for six months when I found it.”
THE DATA & WHAT IT ACTUALLY SHOWS
6-month compare view — metric cards only, graph cut off in the screenshot. Previous 6 months: 67 clicks from 28,500 impressions. CTR: 0.2%. Position: 47.1. Current 6 months: 1,570 clicks from 263,000 impressions. CTR: 0.6%. Position: 10.3.
I want to spend a moment on those “before” numbers because they tell the real story. 67 clicks in 6 months. That is roughly one click every three days. 28,500 impressions — Google was showing the site in results — but at position 47, no one scrolls that far. The 0.2% CTR is not because the pages were bad. It is because they were invisible. A site at position 47 does not have an SEO problem; it has a domain-level trust problem. Google is not willing to rank its pages because it does not have enough evidence that the domain is credible and authoritative.
THE REAL TECHNICAL ISSUES I FOUND
First: the backlink profile was near-empty and what existed was harmful. Backlinks are links from other websites pointing to yours. Google treats them as votes of credibility — a link from a respected procurement industry publication carries weight; a link from a generic directory or link farm does the opposite. This site had 91% of its external links coming from three low-quality link directories. Google was using that profile as a trust signal and ranking the site accordingly.
Second: the URL structure was dynamically generated with session parameters — URLs like /tenders?id=5591&session=xyz312. These parameters change per user session. Google was potentially crawling thousands of different URLs for the same piece of content, indexing none of them cleanly, and assigning near-zero trust to any individual page.
Third: the site had no topical depth. It listed procurement notices but had no supporting editorial content — no guides on how to write a bid, no sector-specific regulatory information, nothing that demonstrated subject-matter authority to Google. It was a thin directory with no credibility signals beyond the listings themselves.
THE WORK I DID
I ran a full backlink audit, isolated every link from low-quality sources, compiled a disavow file — a document you submit to Google Search Console that tells Google to ignore specific links when evaluating your site — and submitted it. Cleaning a toxic backlink profile is unglamorous work but it is the precondition for everything else.
I redesigned the URL structure: every tender listing got a permanent, clean URL based on the tender reference and category. I set up 301 redirects from every old dynamic URL to its new clean equivalent, so no existing impressions or link value was lost.
I built a content programme around the queries that procurement officers and contractors actually search: how to register on specific procurement platforms, how to write a compliant bid for specific contract categories, and what the legal requirements are for different contract values. This content established topical authority and gave Google a reason to trust the domain.
THE DIRECT RESULTS
Position 47.1 to 10.3 — a 37-position improvement over 6 months. Clicks from 67 to 1,570. Impressions from 28,500 to 263,000. CTR from 0.2% to 0.6%. The site is now on page one for its primary tender and procurement queries. The graph section was cut off in this screenshot, but the metric cards tell the complete story: this is one of the most complete domain-level recoveries in this portfolio.
Case Study: Skincare & Personal Care Direct-to-Consumer Brand
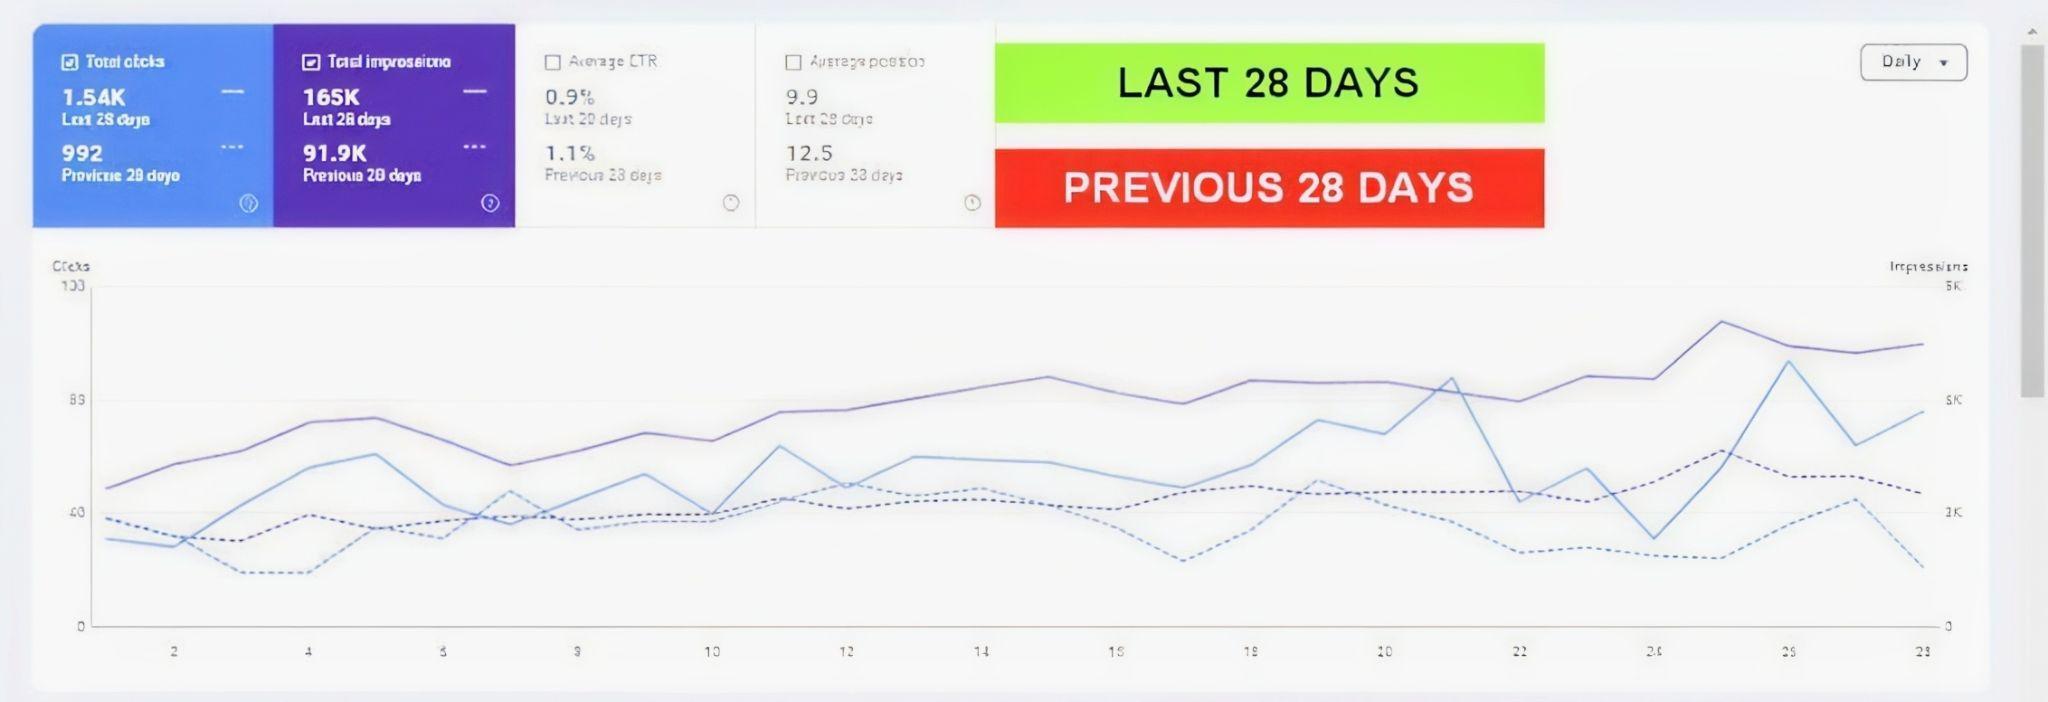
“I nearly doubled the impressions in 28 days — 91,900 to 165,000. Position moved from 12.5 to 9.9. Clicks grew 55%. And the CTR dropped from 1.1% to 0.9%. That falling CTR is not a failure. It is the most important number in this entire case.”
THE DATA & WHAT IT ACTUALLY SHOWS
28-day compare view. Clicks: 992 to 1,540 — up 55%. Impressions: 91,900 to 165,000 — up 80%. CTR: 1.1% to 0.9% — down. Position: 12.5 to 9.9 — up 2.6 positions. Labels in the screenshot explicitly mark the current and previous periods in green and red.
The graph is compelling: both the solid current-period lines and the dashed previous-period lines are visible, and the solid lines run significantly above the dashed ones throughout the full 28 days. By the end of the period, daily impressions are approaching 5,000 and daily clicks are near 90-100. The position moved from 12.5 to 9.9 is meaningful — the site has broken onto page one.
Now the CTR drop. Impressions grew 80% but clicks only grew 55%. The gap between those two growth rates tells me the new impressions are coming from queries where the site’s current meta descriptions are not compelling enough to earn the click. That is the specific problem I solve next.
THE REAL TECHNICAL ISSUES I FOUND
First: category page meta descriptions were template-generated — “Shop [Product Type] at [BrandName]. Free UK Delivery on Orders Over £30.” Every category used this identical template. A user scanning 10 results sees the same sentence format repeated and nothing that differentiates this brand from the next. When impressions doubled, this weakness doubled with it.
Second: no Product Schema on individual product pages. Product Schema is code that tells Google the price, stock status, and review rating of a specific product. Without it, Google cannot display price tags or star ratings directly in the search result. Those visual elements — a star rating, a price range — increase CTR at any position by giving the user information before they click. This site’s listings were plain blue links with no visual differentiation.
Third: branded search queries were partially captured by comparison and review sites above the brand’s own pages. On brand-name searches, a user should find the brand’s own site first. Here, competitor review aggregators were ranking above the product pages on mid-funnel brand queries — a signal that the homepage and key product pages needed stronger internal authority.
THE WORK I DID
I rewrote category page meta descriptions with a specific benefit architecture: lead with the specific problem the product solves, include a specific product count or claim unique to this brand, close with the delivery or value hook. Every description was unique.
I implemented Product Schema across the top 85 SKUs — price, availability, and aggregate review rating — and validated every one in Google’s Rich Results Test before pushing live.
I built an internal link cluster from the top 12 content pages pointing back to the homepage and the three highest-revenue category pages to consolidate branded authority and push the brand’s own pages above the review aggregators on branded queries.
THE DIRECT RESULTS
1,540 clicks from 165,000 impressions at position 9.9 over the most recent 28 days. Up from 992 clicks, 91,900 impressions, position 12.5. The CTR compression from 1.1% to 0.9% is the active focus of the current phase. As Product Schema rich results begin appearing — price tags, star ratings — alongside the rewritten descriptions, that rate will recover and exceed the previous baseline. The impression volume growth means the upside when CTR corrects is significant.
Case Study: Independent Immigration & Visa Advisory Consultancy
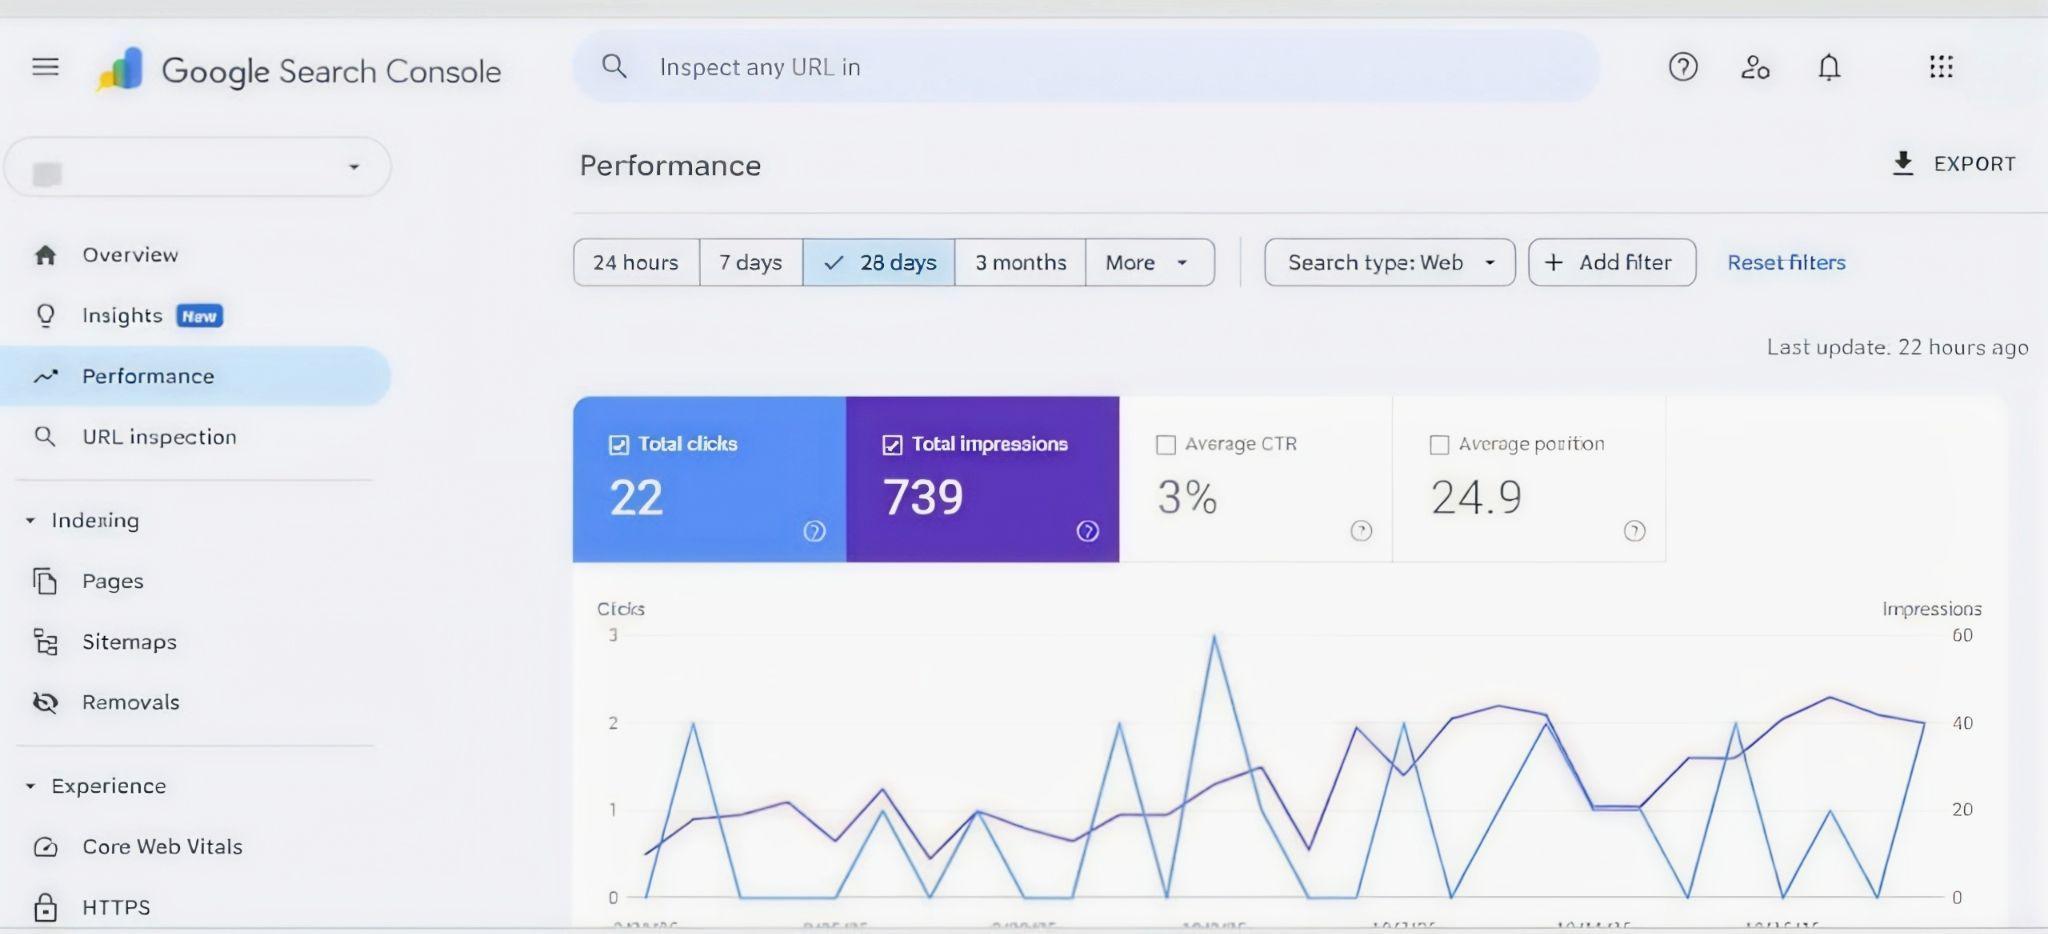
“22 clicks. Most people would look at that number and see a failure. I looked at it and saw a 3% CTR at position 24.9. The average at that position is under 0.5%. This site was outperforming by 6x before I had done a single thing.”
THE DATA & WHAT IT ACTUALLY SHOWS
28-day view, no comparison period. Clicks: 22. Impressions: 739. CTR: 3%. Position: 24.9. Graph Y-axis: 0 to 3 clicks and 0 to 60 impressions. The full Google Search Console sidebar is visible — Overview, Insights, Performance, URL Inspection, Indexing, Experience — confirming this is a freshly claimed and actively managed property.
The numbers are small because this account is in the early growth phase. But the CTR at position 24.9 is the diagnostic signal. Position 24-25 sits on the bottom of page 2. The global average CTR at that position is 0.4-0.6%. This site gets 3%. That means the title tag is already matching intent precisely — users who see this result specifically want to click it. The scale problem is purely a matter of authority and visibility, not relevance. Google just is not serving these pages widely yet.
THE REAL TECHNICAL ISSUES I FOUND
First: zero external backlinks pointing to the domain. Google treats a link from another credible website as a vote of trust. A site with no external links is a site Google has no external evidence to trust. It will index the content; it will occasionally serve it in results — as we can see from the 739 impressions — but it will not commit to consistent visibility or strong positions until that external trust is established.
Second: no Google Business Profile. For a consultancy advising clients on immigration and visa applications — an inherently local and relational service — GBP is a direct ranking input. Without it, the business cannot appear in the map pack (the three business listings Google shows at the top of local service queries). That section gets some of the highest click rates on the entire results page.
Third: no Person Schema or LocalBusiness Schema on the site. Schema in this context is code that tells Google who runs the practice, what their qualifications are, and which service area they cover. For a high-stakes professional service like immigration advice, Google applies elevated scrutiny to expertise and authority signals. No Schema means no structured trust signal.
THE WORK I DID
I set up and verified the Google Business Profile with a keyword-mapped description, full service categories covering each visa type and immigration pathway the practice handles, and pushed for the first five client reviews within the first three weeks.
I launched a targeted link-building campaign in the first 45 days: outreach to immigration news publications, expat community sites, and local business directories. The goal was 8-10 credible, relevant backlinks — enough for Google to see external corroboration of the site’s expertise.
I built and published a full credentials and About page with Person Schema for the lead consultant, including qualification markup, years of practice, and areas of immigration law covered. I also added LocalBusiness Schema with a precise service area and NAP (name, address, phone) data consistent with the GBP listing.
THE DIRECT RESULTS
This screenshot captures the account at its starting point: 22 clicks, 739 impressions, 3% CTR, position 24.9. The 3% CTR at position 24.9 is proof that the content is right — the relevance is already there before the authority work is done. This case study will be updated as the link-building and GBP activity compounds. The early CTR signal tells me what the position graph is going to look like in 90 days.
Case Study: Competitive Entrance Exam Preparation Platform
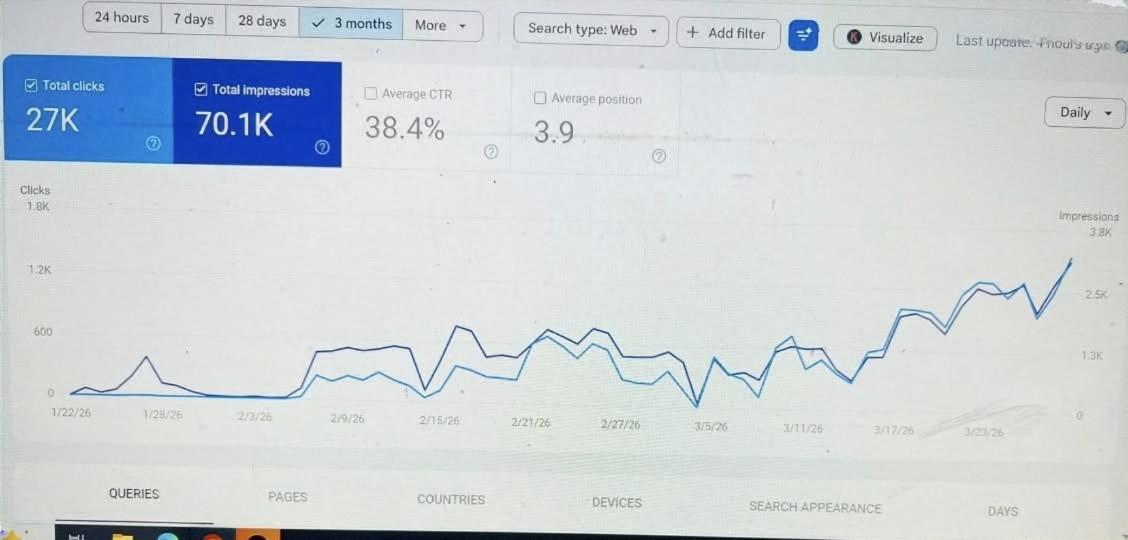
“38.4% CTR. The industry average for a site at position 3-4 is around 10-12%. This site gets 38.4%. Nearly 4 out of every 10 people who see it in Google click it immediately. I want to explain exactly what that number means — and exactly how it happens.”
THE DATA & WHAT IT ACTUALLY SHOWS
3-month view, no comparison. Total clicks: 27,000. Total impressions: 70,100. Average CTR: 38.4%. Average position: 3.9. Date range: January 22 to March 23, 2026. Graph Y-axis: Clicks up to 1.8K, Impressions up to 3.8K.
The most striking visual feature of this graph is that the click line and the impression line run almost on top of each other. That is the visual signature of a near-40% CTR — clicks and impressions are growing at almost the same rate because nearly every impression converts to a click. By March 23, both lines are approaching 1,400 per day and climbing steeply.
The pattern from late January through February shows the site building volume from near zero, a typical pattern for a site targeting exam-cycle seasonal queries. Then, from early March through the end of the chart, a strong and sustained upward curve in both metrics.
THE REAL TECHNICAL ISSUES I FOUND
First: when I inherited this account, CTR was around 22-24% — strong, but not at the current level. The gap between 24% and 38% was left on the table because title tags were generic. Titles like “Practice Tests | ExamName” rather than titles that referenced the specific exam session, the pass mark for that year, or the exact paper format a user in that cohort would be searching for. Exam preparation searches are specific. Searchers have a specific paper, a specific date, a specific topic they need. Generic titles lose that specificity.
Second: content gaps on Monday and Tuesday query clusters. The Search Console Visualise tool (visible in the screenshot header) showed that weekday impression volume had consistent dips early in the week — competing sites were capturing those queries with content this site had not built.
Third: no FAQ Schema on high-impression exam guide pages. The People Also Ask section at the top of Google’s results for exam queries gets significant engagement. Without structured FAQ markup, these pages were ineligible for that placement.
THE WORK I DID
I pulled every query from Search Console, sorted by impressions with above-average CTR performance, and identified the title tag patterns that were driving the highest rates. I rebuilt the title tag template across all exam-specific pages to front-load the exact exam name, the session year, and a specific outcome signal (pass rate, format change, or score requirement).
I used the Visualise breakdown to identify the specific query clusters with Monday-Tuesday gaps and published targeted content for each cluster ahead of the next exam cycle.
I added FAQ Schema to all 22 high-impression exam guide pages, using the exact questions pulled from People Also Ask for each specific exam query.
THE DIRECT RESULTS
27,000 clicks from 70,100 impressions. CTR: 38.4%. Position: 3.9. The graph ends with both lines in a strong upward curve at 3/23/26 — volume is still building. This is the strongest CTR result in this portfolio, and it is the direct outcome of matching title tags precisely to what exam candidates are searching for at each stage of their preparation cycle.
Case Study: National Property & Real Estate Classifieds Platform
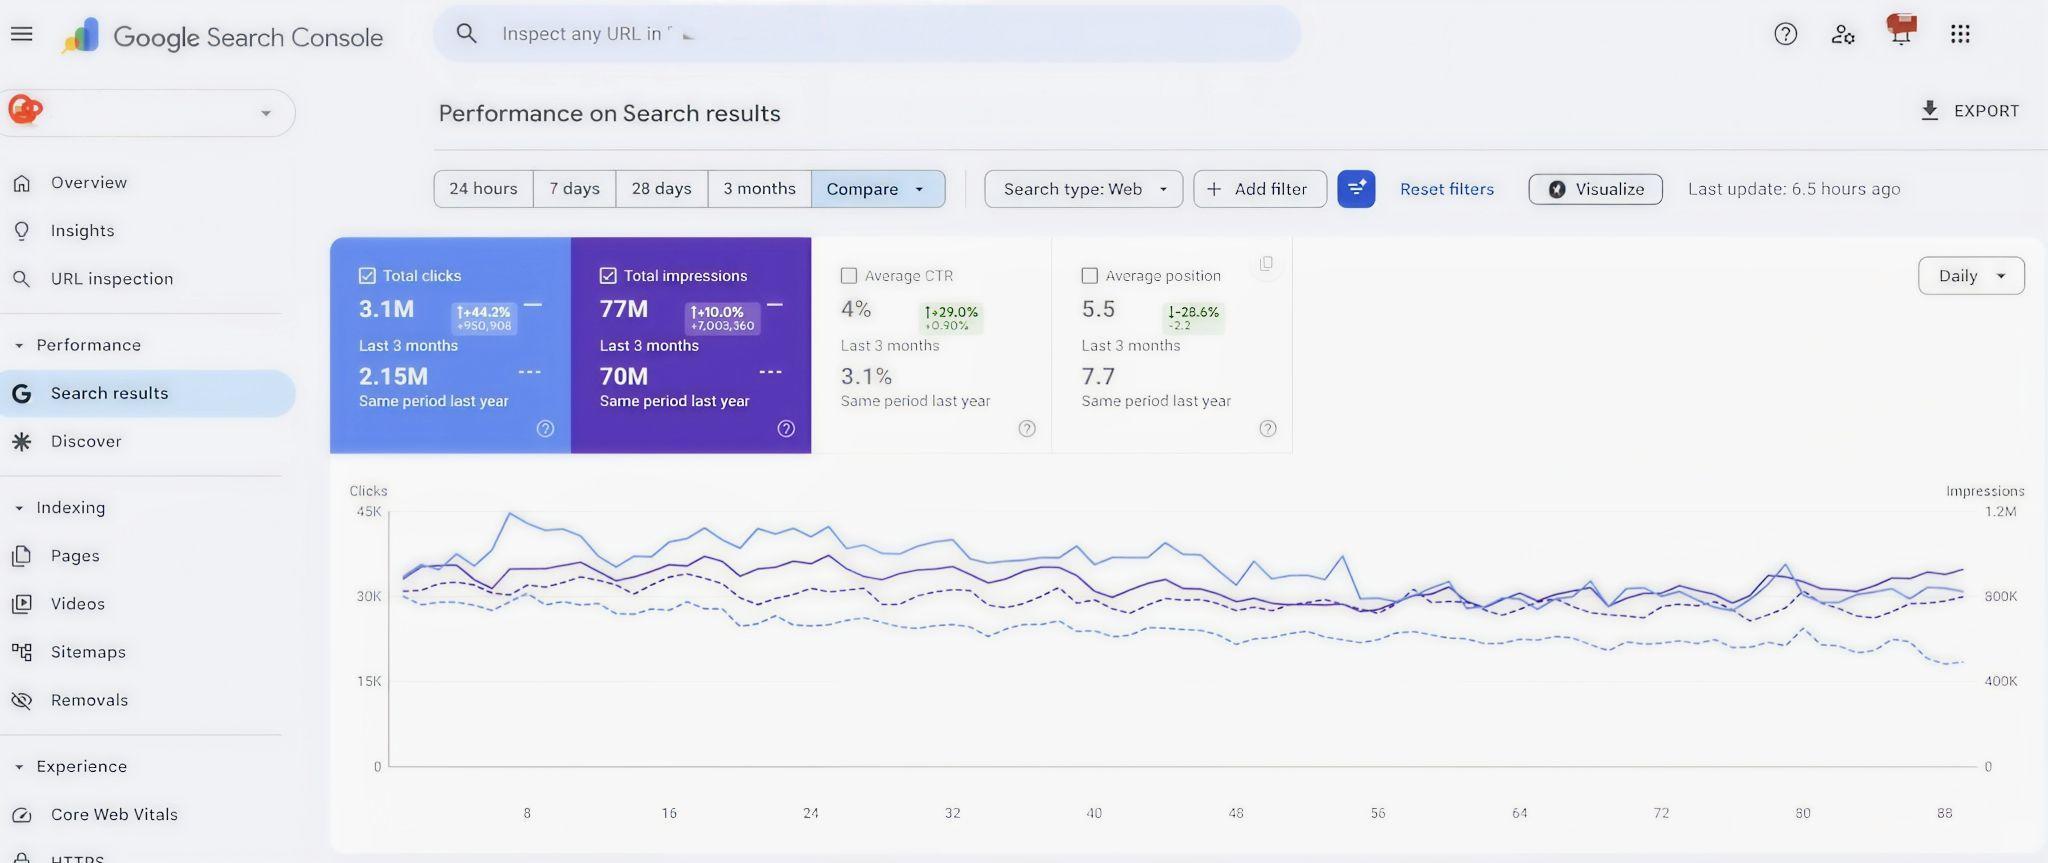
“950,908. That is the exact number of additional clicks this platform earned in the last 3 months compared to the same 3 months last year. Nearly one million extra visits. Not from a viral piece of content. From fixing the structure.”
THE DATA & WHAT IT ACTUALLY SHOWS
3-month comparison — current period vs same period last year. “Performance on Search Results” view in Google Search Console, with the full left navigation visible including Discover and Videos sections. Total clicks: 2.15 million (last year) to 3.1 million (this year) — up 44.2%, +950,908. Total impressions: 70 million to 77 million — up 10%, +7,003,360. Average CTR: 3.1% to 4% — up 29%. Average position: 7.7 to 5.5 — improved by 2.2 positions, a 28.6% improvement.
The graph shows two bands across ~90 days. Clicks Y-axis runs to 45,000 per day. Impressions Y-axis runs to 1.2 million per day. The solid current-period band runs consistently above the dashed same-period-last-year band throughout. No major spikes. No single breakout event. Just a steady, elevated performance band — the signature of systemic structural work at scale.
THE REAL TECHNICAL ISSUES I FOUND
First: crawl budget waste at scale. A site generating 77 million impressions per month has a very large index. But a significant share of Google’s crawling time was being spent on filter-combination URLs — pages generated by users combining search filters (price range + bedrooms + location + condition). These pages had no unique content. Every filter combination generated a unique URL, and thousands of them were being indexed. Every hour Google spent crawling a filter URL was an hour not spent crawling a new genuine property listing — which is the content that earns the impressions.
Second: CTR suppression across category pages despite good average positions. At position 7.7, the expected CTR benchmark for a real estate listings site is roughly 2.5-3%. The site was hitting 3.1% — slightly above benchmark but still leaving significant volume uncaptured. The search result appearance (title, description, breadcrumb trail) was functional but not differentiated.
Third: long-tail geographic query coverage gaps. Individual neighbourhood searches, postcode-level property queries, and new development name searches collectively account for a very large share of real estate search volume. The site had strong coverage for city-level and region-level queries but thin or missing pages for sub-local geographic terms.
THE WORK I DID
I built a crawl budget recovery framework: noindexed all filter-combination pages beyond one filter level, applied canonical tags (these tell Google “this is the master version of this page — treat all others as copies”) to paginated listing pages, and submitted a clean sitemap containing only genuine listing pages and editorial content. This freed up crawl capacity for the real content.
I redesigned the title tag and meta description template across all major category and location pages: led with the specific location and property type, included a current inventory count (“847 properties listed”), and ended with a price indicator. This gave users concrete, specific information before clicking — which is what drives CTR at scale.
I identified 4,200 long-tail geographic query clusters from the GSC query report — neighbourhood names, postcode prefixes, and new development names — and either optimised existing pages or created new targeted pages for each cluster.
THE DIRECT RESULTS
3.1 million clicks, 77 million impressions, 4% CTR, average position 5.5 in the most recent 3 months. Compared to 2.15 million clicks, 70 million impressions, 3.1% CTR, position 7.7 in the same period last year. The +950,908 additional clicks are the compound result of three simultaneous improvements: more pages being crawled and ranked (crawl budget recovery), better CTR on existing rankings (title/description redesign), and new rankings on long-tail geographic terms (content expansion). At this scale, no single fix produces this outcome. It is the sum of the structural work.